Analysis of Influence Factors on VR Animation Viewing Behavior of Chinese Viewers
Hou Zheng Dong, Choi. Chul Young
Department of Visual Contents
Graduate school, Dongseo University
Busan, South Korea
1207711532@qq.com, freechoi21@gmail.com
Abstract
Virtual reality technology has been receiving attention as an emerging technology that started in 2016. In the early stages of dissemination of VR animation works with new technologies such as virtual reality, the number of viewers and the process of use must be observed and predictive analysis must be performed. Based on the Hwasang of the expanded Unified Technology Acceptance Model (UTAUT2), the main body aims to analyze factors that affect viewers' willingness to watch VR animation.
Keywords-component; Virtual reality; style; styling; Unified Technology Acceptance Model
1. Introduction
Since 2016, the advent of HTC Vive, Oculus Lift, and SONY PSVR cameras means that virtual reality manufacturing thresholds have already been lowered. In China, the virtual reality market (the user's direct shopping, advertising, and enterprise software applications) will reach 386.4 billion RMB in 2021, and the company's market will reach 87.8 billion RMB. As the mix of VR technology and animation has increased, VR animation has given viewers a unique experience, especially in areas such as advertising, movies, and education. Based on this backdrop, the research is carried out using the expanded Unified Movie of Acceptance and Use of Technology 2 to focus on the evolution of VR animation. In order to achieve stable development and expand the distribution category, the new images must be analyzed and studied the intent of consumption behaviors of viewers, starting from the early stages of acceptance and distribution. From this point of view, the significance of the study can be found.
2. Theoretical background
Benkatesh and others have established an expanded integrated technology acceptance model based on the UTAUT model. Empirical studies show that the distribution of behavior in extended integrated UTAUT2 compared to UTAUT models increased from 56% to 74% in terms of analysis and from 40% to 52% in terms of technology acceptance. The expanded integrated technology acceptance model 2 is the introduction of the new relationship between the introduction of the UTAUT model and the new generation, the existing benefit value, and the habit. VR animation is produced through virtual reality (VR) technology. Currently, there are three types of VR animation experience. Animated work is mainly performed in educational, entertainment, social and entertainment experiences. According to Super Data report, Samsung Gear VR sold 4.51.3 million units in 2017 with 169.3 million units of PlayStation, 3.0.6 million of Oculus Lift and HTC Vive. By August of 2018, VR Animation had provided three platforms, each with a slightly overlap in video content.
3. Model development and hypothesis
This study model preserves five variables, including Performance expectancy, effort expectations, promotion conditions, pleasure motivations, and habits of UTAUT2 model, thus setting the variables as factors that affect consumers' viewing and viewing behavior.
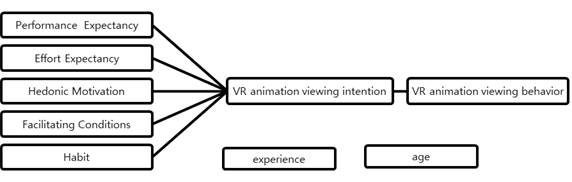
Fig. 1 VR animation study model.
First, performance expectations in this research environment represent the degree of benefit consumers can gain from watching VR animation. Animation art is a culture and a kind of comprehensive art. In other words, no matter what function is used in which field; animation inevitably creates a certain cultural effect in which it is used. Let's look at an educational use case. Oh Sang-mi (2017) said that animation could improve elementary school students' reading skills and increase their interest and interest in English. For users, future use may be reduced if the technology they use is difficult to use, even if it helps them achieve their goals. Davis et al. (1992) combined pleasure and technology acceptance models to claim that pleasure is influenced by the external factors of the technology acceptance model. On the entertainment side, animation works have an entertainment function, and the entertainment content included in the animation gives the audience a sense of spiritual pleasure and satisfaction. Ajzen and Fisherberein (2000) argued that habits act as driving forces to sustain the intent of use. Ochslein et al. (2014), Venkatesh et al. (2012) suggested that habit affects the willingness to use new technology. While research and development of software and hardware used to view VR animations is making some progress, what is more important to consumers is how easy it is to use the programs and devices. According to retail research data released by GFK (GfK China), China's VR technology for 2017 showed an increase of 11% compared to last year's sales of 8.3 billion won. The market began to grow again after the basic restructuring was completed in 2018. Advances in markets have had some influence on both convenience of buying devices that are needed to watch VR videos, level of use and convenience after purchase, and consumption of contents. Benkatesh et al (2012) also suggested in his study that the more appropriate the promotion conditions, the less antipathy and resistance to new technologies can be made. this study formulates the following hypotheses:
H1. Performance expectancy will positively influence VR animation viewing intention
H2. Effort expectancy will increase VR animation viewing intention
H3. Hedonic motivation will positively influence VR animation viewing intention
H4. Habit will positively influence VR animation viewing intention
H5. Habit will positively influence VR animation viewing behavior
H6. Facilitating Conditions will positively influence VR animation viewing intention
H7. Facilitating Conditions will positively influence VR animation viewing behavior
4. Methodology
This study is one of the study of variable impact relationships. The study adopted a survey approach to collect data and conducted a data analysis using the most appropriate tool, SPSS. First, basic parametric analysis was carried out on the collected data, and statistical work was carried out on what gender, age, and distribution situations were like. In the study of impact relationships on data measured in scores, the reliability and validity of the data were analyzed. Finally, the basic attitude of the sample group was studied in relation to descriptive analyses, survey items measured with scores, etc. At this time, with correlation analysis methods, the basic work for regression analysis was carried out by studying the relationships. In addition, under the assumption that data are relevant, the regression impact relationship was studied and the regression analysis method was used to verify the hypothesis.
5. Results
5.1. Respondents’ profile and characteristics
Frequency analyses were conducted to identify the general characteristics of respondents based on the 171 questionnaires collected. According to the analysis, 60 men and women (35.09 percent) and 111 (64.91 percent) respectively were found to be female. Age distribution by age range from 18 to 25, 54 (31.57 percent), 26 to 30 years old (25.15 percent), and 48 people (28.07 percent) aged 31 to 40 years old. From the age of 18, the age of 25 can be seen as the majority of all respondents. The following Table 5 lists the demographic characteristics of the respondents.
5.2. Construct reliability and Convergent validity
Prior to the full-scale analysis, the reliability analysis was carried out to see if the measurement questions were consistently measured. The reliability verification was determined by the Cronbach's Alpha coefficient, which identifies the internality of the scale. The Cronbach's α factor has a value between 0 and 1, and social science determines that reliability is high. The analysis of a total of 14 questions in the seven variants used in Table 6 shows that most of the variables were found to be from 0.630 to 0.855. An exploratory factorial analysis was performed using SPSS to determine the validity of the measurement variables. The KMO measure value (Kaiser-Meyer-Olkin), which indicates whether the correlation between the variables is well explained by other variables, was generally considered good with a value of 0.8.
5.3. Verification of hypotheses
Detailed results showed that the performance expectation had a static influence on the purpose of viewing, and that the condition of promotion and habit had a static influence on the intention of viewing. The expected and pleasurable motivation has not proven significant influence. The results of this analysis showed that the performance expectation had the greatest impact on the audience's intent, and that it was able to determine the influence of the spirit in the order of promotion conditions and habits. This regression equation shows modified R2=0.327 and Durbin-Watson = 1.895 and has a 32.7% explanation for the regression formula. In addition, Durbin-Watson appears to be 1.895, indicating that no residual exists in this regression equation.
Visitors' intent and habit were shown to have a positive influence on viewing behavior, and if you look at the regression equation, the revised R2=0.343 and Durbin-Watson =2.020 were found.
5.4. Validate adjustment effects
The results of the study show that “gender” and “age” have adjustment effects on Performance Expectancy and Effort Expectancy.
6. Conclusion
Results show that the performance of the anticipation, habits and promoting factors will have a positive impact to the audience to watch VR animation, the performance of positive influence is biggest, habits and promoting factors of positive impact is relatively small, that is to say, VR animation can bring the function of the utility can reaction of the audience most willing to watch the VR animation, therefore, in the VR animation production planning, increase the contents of the can let audience learn, or increase the contents of the can let the audience feel have practical use can let the audience more willing to watch the VR animation. The promotion factors show a positive influence relationship in the results of this study. Therefore, it is important for the audience to have convenient channels to watch VR animation. For example, it is important to increase the experience store of VR animation, or like Google stories, it is also possible to watch VR animation by only using mobile terminals. Used in this study has a positive impact on the audience also, habits is essentially "procedural memory", psychologists say habits is divided into three parts: suggest - behavior - reward, from this point of view, VR animation in the process of production, especially interactive VR animation, can provide more in the process of viewing audience can choose the different development of the plot, rich interactivity, or add incentives like games.
In the results of this study, efforts to look forward did not have an impact on viewing behavior. The reason for analysis may be that modern audiences have good receptivity to new technology affairs, and learning and use are relatively simple. Entertainment motives no has no effect on viewing behavior, there may be several reasons: first, the current audience entertainment project selection is more, but VR animation for the audience, there are problems in the experience, such as the VR devices owing to lack of resolution and screen refresh rate, cause vision, body feeling out of sync, even to an audience of vertigo.
Secondly, most of the entertainment factors of VR animation are generated through the interaction between the audience and the film. There are also technical problems in how to make the audience have no barriers to interact. For both of these reasons, developing the right hardware or software solution might be one of the ways to solve the problem.
References
[1] L. G.Lee, J.H.Chung “A Study on Visual Mise-en-Scene of VR Animation <Pearl>,” Journal of digital convergence, vol. 15, pp. 407-413, September 2017.
[2] I. H. Lee, “A Study of Reality Effects on 360 Degree Virtual Reality : Focusing on Talk Show VR’s Presence & Impressive Effect,” Korea Science & Art Forum, Vol. 31, pp. 293-303, January 2017.
[3] J. H. Sook, “New Media Art Based on VR - Materiality or Immateriality,'' Journal of the Association of Western Art History, Vol. 34, February 2011, pp. 259-283.
[4] J.H.Lee, “The new explore of the animated content using OculusVR - Focusing on the VR platform and killer content,” Catoon & Animation Studies, vol. 45, pp. 197-214, December 2016, pp.197-214.
[5] W.L. Moon, “VR and Cinema,” Cine forum, Vol. 22, December 2015, pp351-375.
[6] J. C. Kim, J. M. Pyun,“A Study on User Flow Subjectivity of VR Image Contents Design,” Journal of Cultural Product & Design, vol. 47, December 2016. pp. 740-741.